Knowledge Base
Add a Web Check (HTTP or HTTPS)
What is a web check?
A web check is used to ensure that end users can interact with web applications efficiently. An HTTP(S) check, also known as a header check, monitors web server response times and status codes for a domain. You can check your website’s status and make sure your web server is up and responding from many different locations. In Constellix, you have the ability to customize your own Web Checks. We’ll go over all of those options in this article, plus a few tips to make your job easier.
1. Web Check
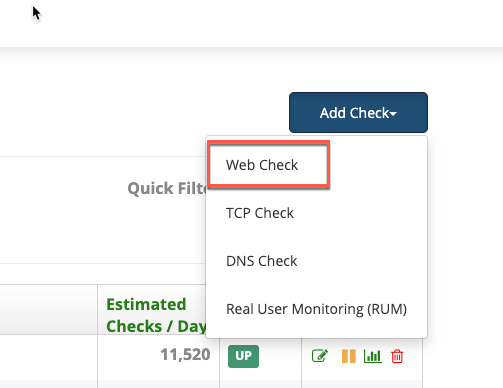
To create a Web Check, click on “Add Check” and select “Web Check”.
2. Name
Enter the name of your Check in this field. This name will also show up in the notification emails when the check goes down and comes back up.

3. Version/Protocol
Select the IP version you will be monitoring as well as the protocol that will be used to configure the host.

4. Host
Enter the Hostname or IP address you would like us to monitor. (Note: If you are monitoring a CDN you would enter the FQDN of the CDN in this field.)

5. Port
Enter the Port you would like us to connect to on your system. (For example, if you selected HTTP as the “Protocol” you would select “Port 80”.)

6. Interval
Choose how often you want our monitoring nodes to check the status of your endpoint. Keep in mind, if you choose a shorter time, the more costly it will be. Also, consider that the more monitoring locations you choose will reduce the interval time if you choose the “Once per Site” or “Once per Region” interval policies.
Since we are running checks from multiple locations at each interval, the interval period is actually reduced to Interval/Monitoring Locations and can be as short as a fraction of a second.

7. Interval Policy
Choose how many locations are checked at each check interval.
All Agents Per Interval - All selected agents will initiate a check simultaneously at each check interval. For example, if you have 5 selected agents with a 30-second interval, a check will run from all 5 agents every 30 seconds.
One Agent Per Interval - A check will run from an individual agent at each check interval. For example, if you have 5 agents selected with a 30-second interval, one check will be run from one of the selected agents every 30 seconds.
One Agent Per Region Per Interval - A check will be run from one agent in all selected Regions per interval. For example, if you have 2 agents selected in all 6 regions with a 30-second interval, a check will be run from one agent in each selected region every 30 seconds.

8. Verification Policy
Next, select a policy that will determine how agents will decide if a check is UP or Down.
Simple - When a monitoring node detects an endpoint as down, we will also check from a nearby location to verify. If the verification confirms the original report we will consider the check as Down.
Majority - Determine whether the check is UP or DOWN based on what the majority of the selected agents are reporting. Note: We recommend that you select at least 3 agents if you chose this option.

9. Check Regions
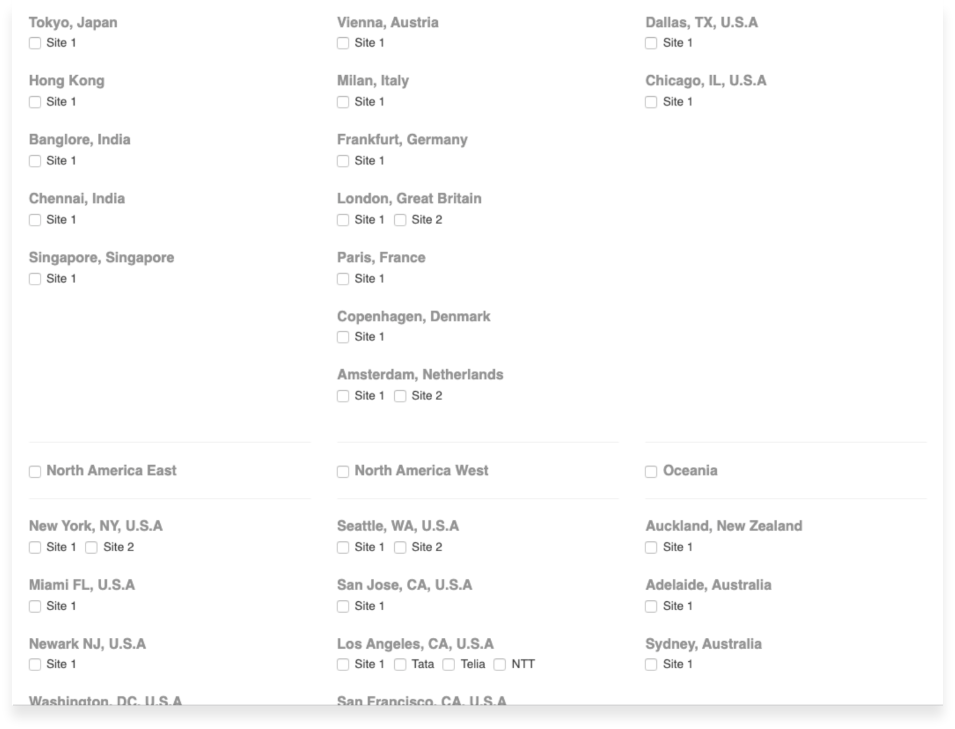
Select monitoring agents by clicking on "View or Select Monitor Agents".

Then check the box next to the agent you would like to monitor your site. You can select an entire region by checking the box next to that region.
10. Contact Groups
These are pre-configured groups of contacts that you can define within the Contacts Groups. All users in the chosen group(s) will be notified of UP/DOWN status changes, but only when they are scheduled to receive alerts.
If you would like to receive a notification when the status of a check changes you can select from one of the "Contact Groups" you have created. If you do not have a contact group and would like to create one please follow the following tutorials.
Here is the tutorial for creating a Contact Group.
Here is a tutorial for creating a Contact.

11. Notification Report
The notification report allows you to define the amount of time you would like the notification report to be available after an event or check status change has taken place.
Whenever a check is detected as DOWN, we will send an email with a notification report attached displaying information regarding the outage.

12. Advanced (Optional)
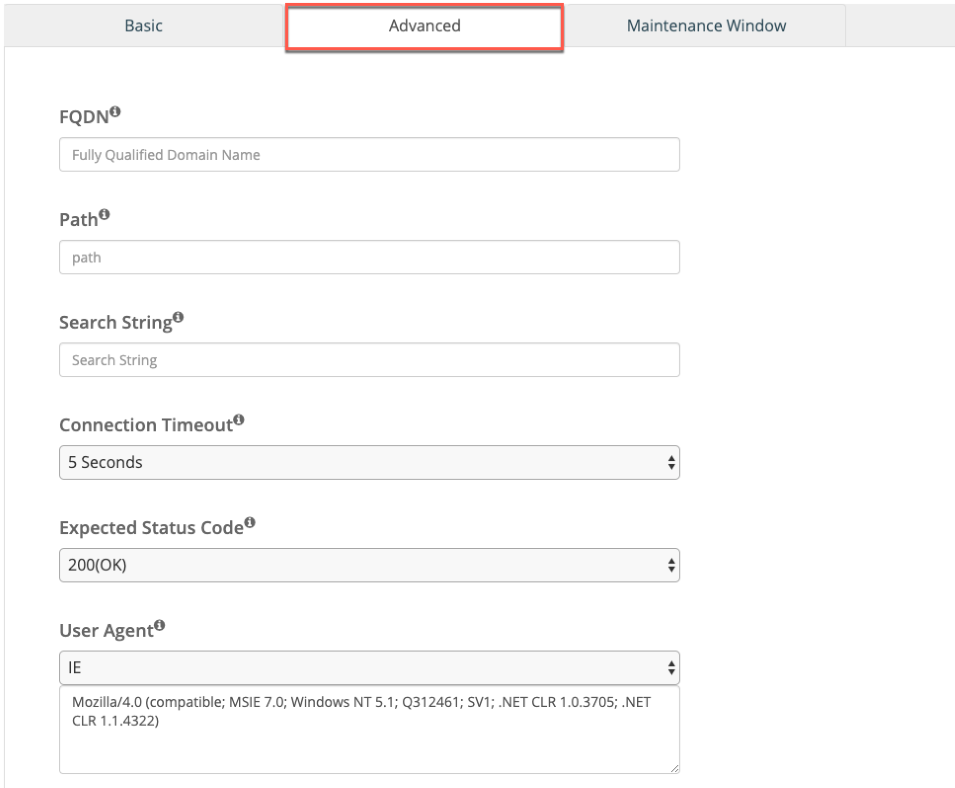
For advanced monitoring options, click on the "Advanced" tab.
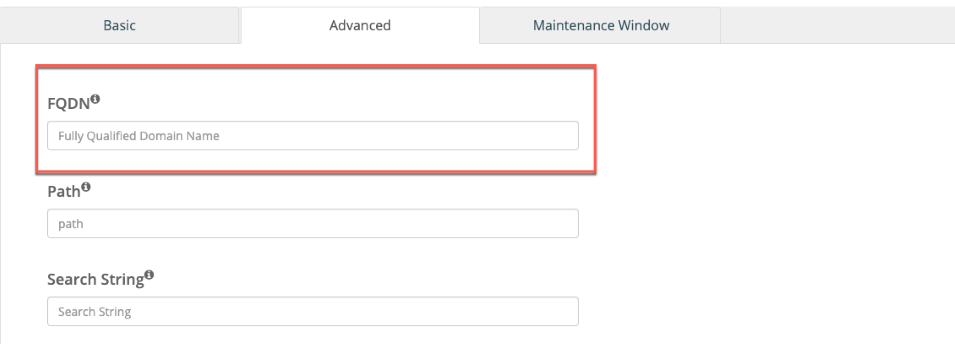
13. FQDN
Enter the FQDN you would like us to pass in the header of our request.
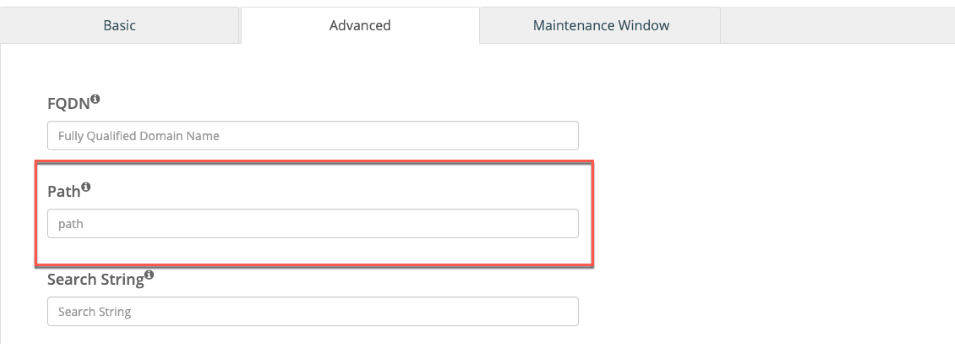
14. Path
If required, enter the path that would be added to the end of the request header. This would be the path of your URL if one is necessary.
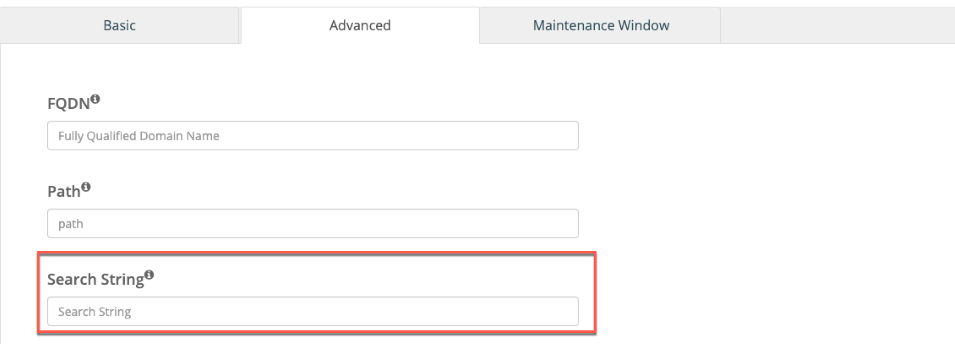
15. Search String
The search string field allows you to define a specific string that our nodes will search for within the first 2KB of data on the page.
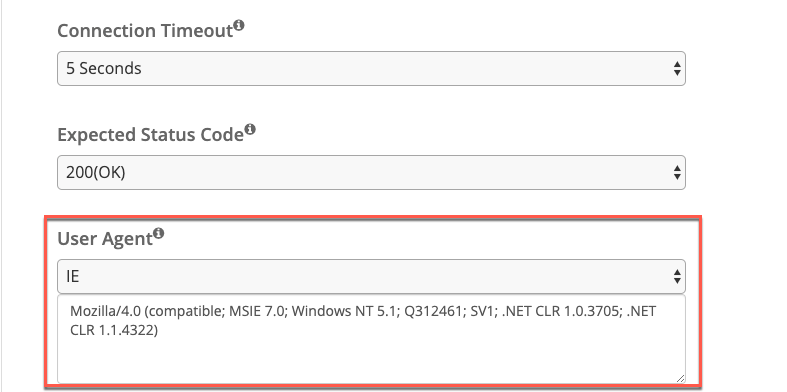
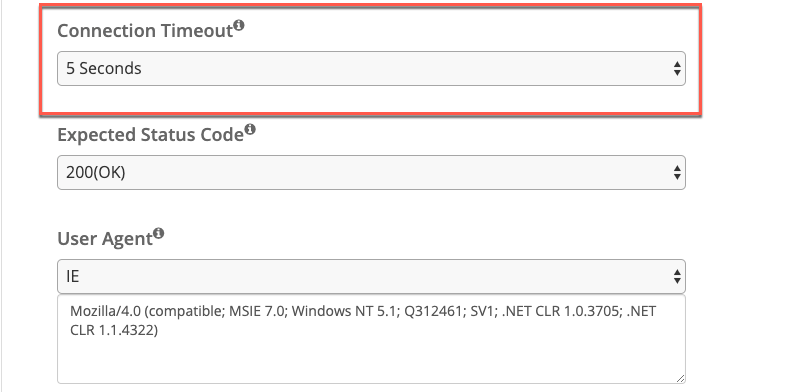
16. Connection Timeout
The "Connection Timeout" field allows you to predefine a set time we should wait for a response from the server. By default, we will wait 5 seconds.
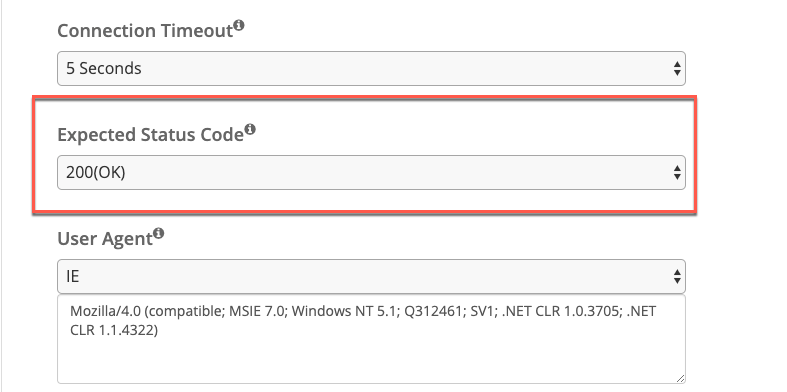
17. Expected Status Code
The "Expected Status Code" field allows you to predefine a status code response our monitoring nodes should receive from your servers. By default, we will check for a 200 OK response.
18. User Agent
The "User Agent" field allows you to define a "User-Agent Request Header" that we will send in the header of our request. This string would contain the application type, operating system, software vendor, or software version of the requesting software user agent.
