Knowledge Base
Export the Raw Data Logs for a Check
The raw data log shows the activity that occurred in the configured monitoring check such as when the IPs were available and not available based on the service and protocol configured.
1. On the main dashboard, select the raw data log icon next to a check.
![]()
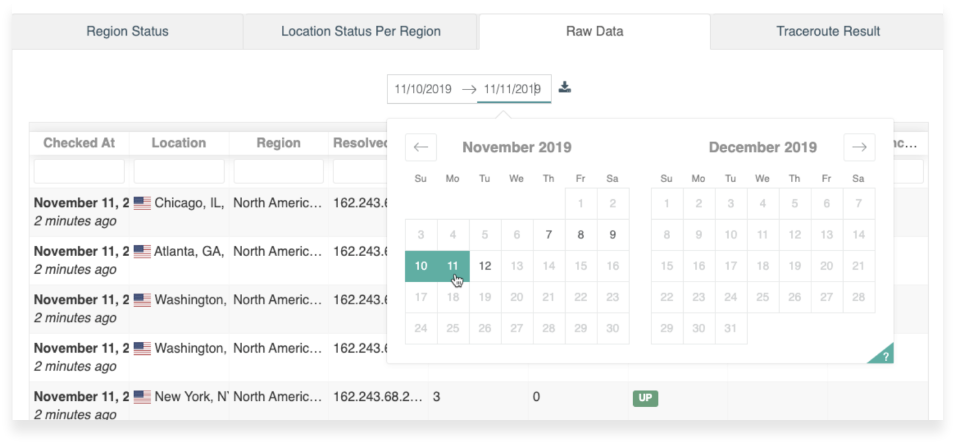
2. Select the Export Result box and select a time frame.

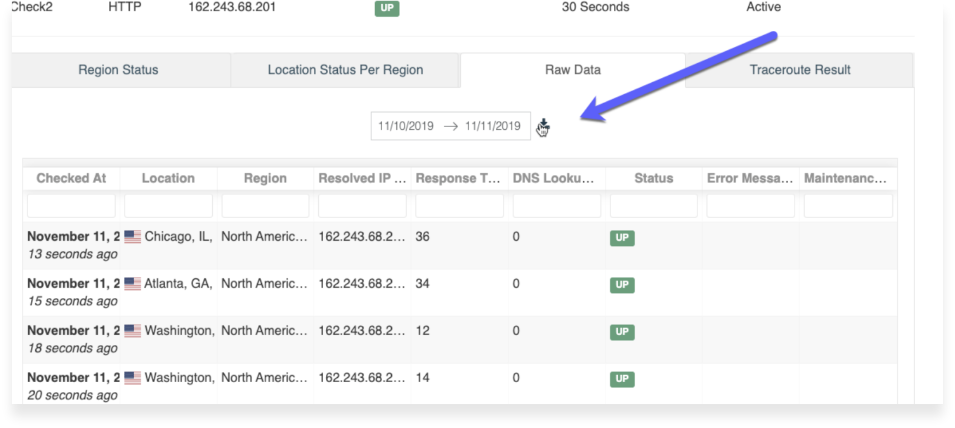
3. Click the “Download” button and select a format. The browser will download the file automatically.


