Knowledge Base
How to View the Raw Data Logs for a Check
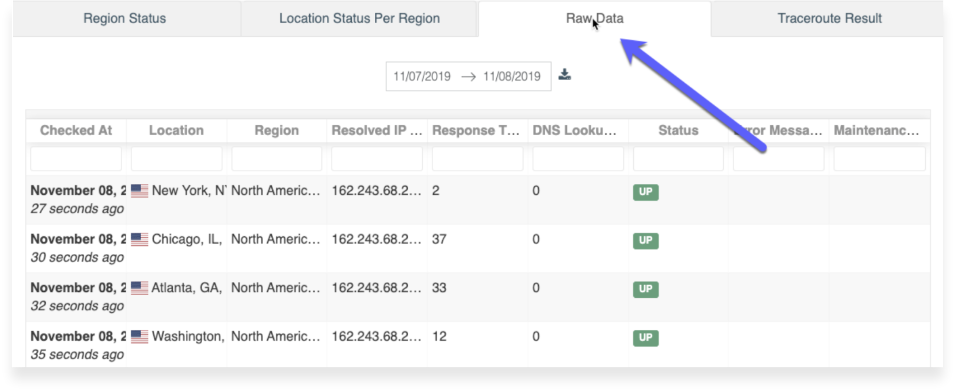
Raw Data Logs
The raw data log shows a consolidated history of check results from all monitoring locations which are part of the regions selected for the check. Each region has multiple monitoring locations.
This data includes the resolved IP of the host, its response time (in milliseconds), and its status. To export the raw data log of a check, click here.
1. On the main dashboard, select the Result Log icon next to a check.
![]()
2. Click on the Raw Data tab to see more detailed response times.


