
- Contact us
-

choose your language
-

Knowledge Base
View Monitoring Charts and Logs for a Check
What are monitoring charts?
The monitoring charts consolidate all data about the check from all monitoring locations which are part of the regions selected for the check. Each region has multiple monitoring locations. Graphs are included for the average response time (in milliseconds), in real-time, and in one-day or three-hour time frames from each monitoring region. To view the result log for a check, click here.
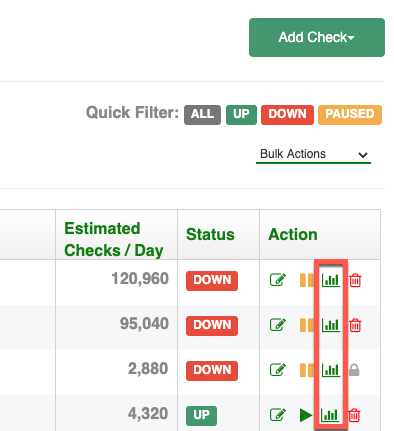
View Chart
On the main dashboard, select the View Chart icon next to a check.
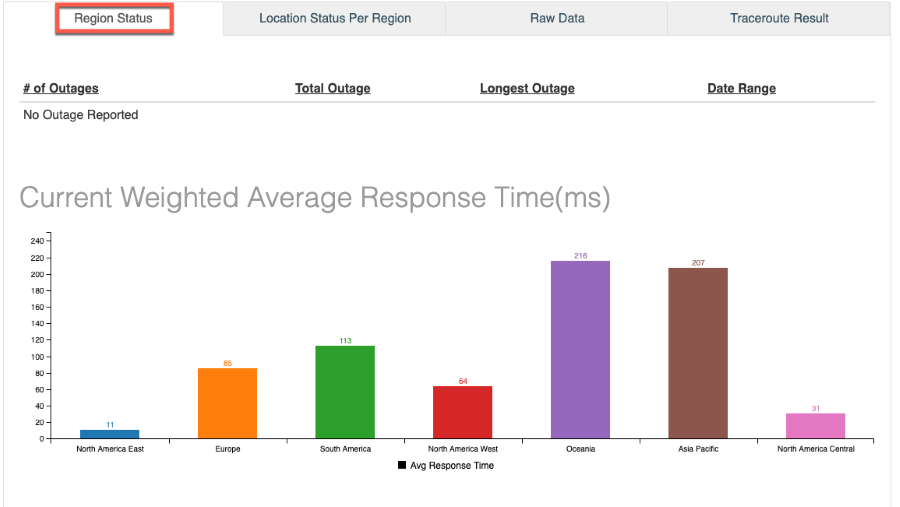
Region Status
From the Region Status tab, you can view your average response times and an outage report.
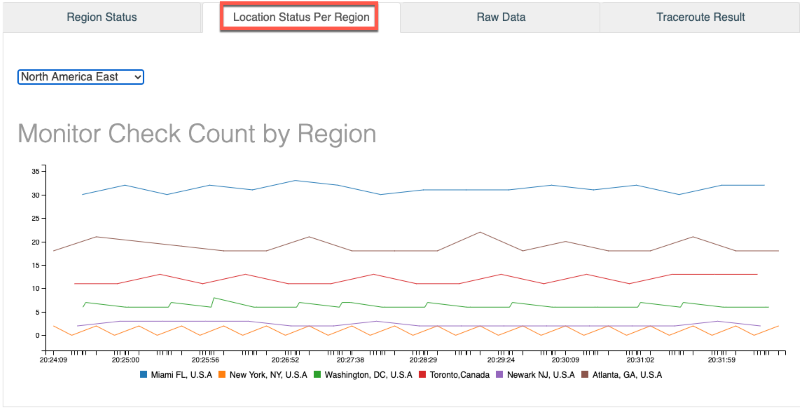
Location Status Per Region
Here you can view the amount of Sonar checks that are being run and from where.
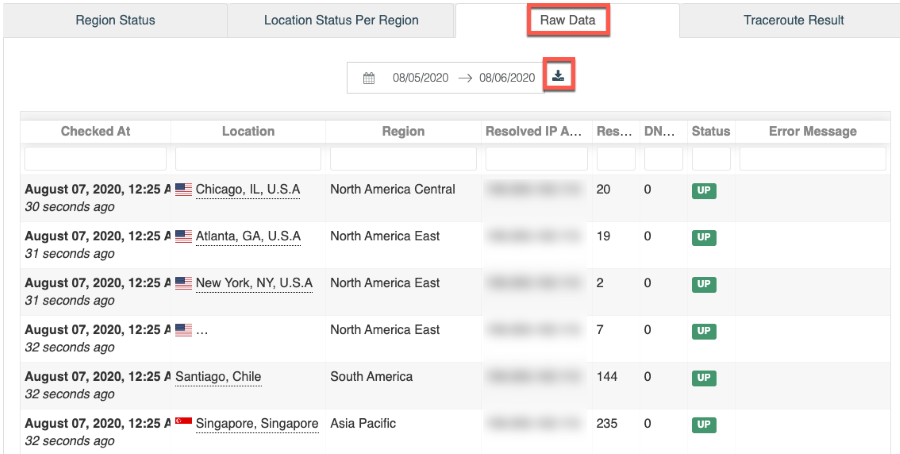
Raw Data
The resulting log shows a consolidated history of check results from all monitoring locations which are part of the regions selected for the check. Each region has multiple monitoring locations. This data includes the resolved IP of the host, its response time (in milliseconds), and its status. To export the result log of a check, set the desired dates in the box at the top and then click the download button (smaller red box).
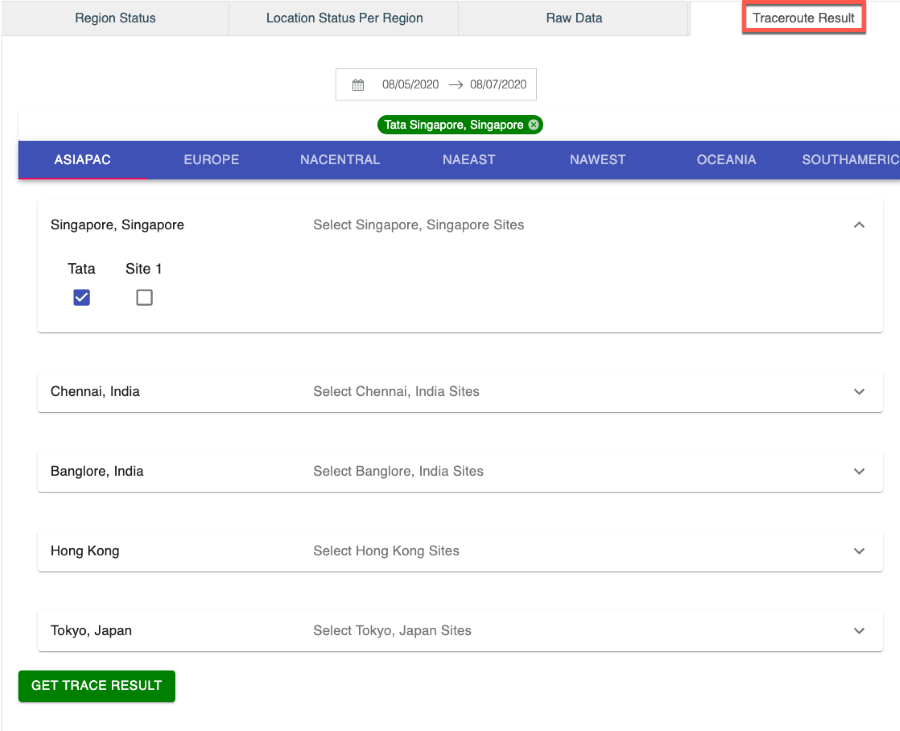
Traceroute Result
Run a traceroute from any of our nodes to the check's endpoint. Simply select the region, PoP, and site to run from and click Get Trace Result.
-

The most-trusted global provider of high-assurance TLS/SSL, PKI, IoT and signing solutions.
-


-
© 2022-2025, DigiCert, Inc. All rights reserved.
Cookie Settings
