Knowledge Base
Data Explorer | DNSME | Knowledge Base
Data Explorer is a brand new suite of tools found within DNS Analytics that give you a thorough and detailed breakdown of queries and records in your domains.
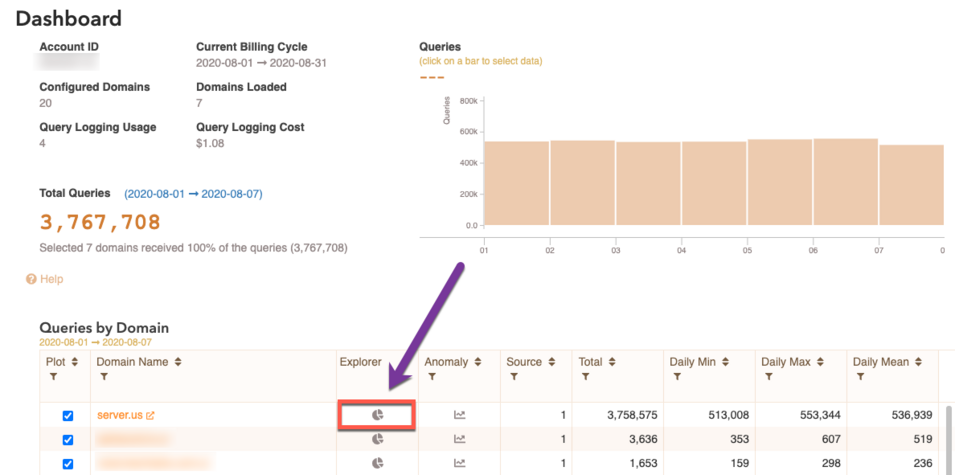
To get started with Data Explorer, log into DNS Analytics and then click the pie chart button next to the domain of your choice.

You are now at the Data Explorer dashboard. Here you can see your domain ID, number of configured records, what record types are used and the graph to the right shows how many queries each record type is getting within the parameters of the time series (scaled). Both the query count and total percentage are visible in the Scaled view.

If you would like to view the chart with the actual proportions as apposed to scaled, click the Actual tab above the chart.

This chart can be used in conjunction with any and all of the categories just below it. So for example, if you'd like a visual breakdown of how much traffic is coming to each PoP, click the Location tab.

Flipping between these tabs also changes the spreadsheet below them which provides a more in-depth breakdown of the data in the chart above. There is also a filter function for each category in the spreadsheet to help you narrow in on the data you need. To use the filter function, click the filter icon button below the category. 
Time Series Explorer
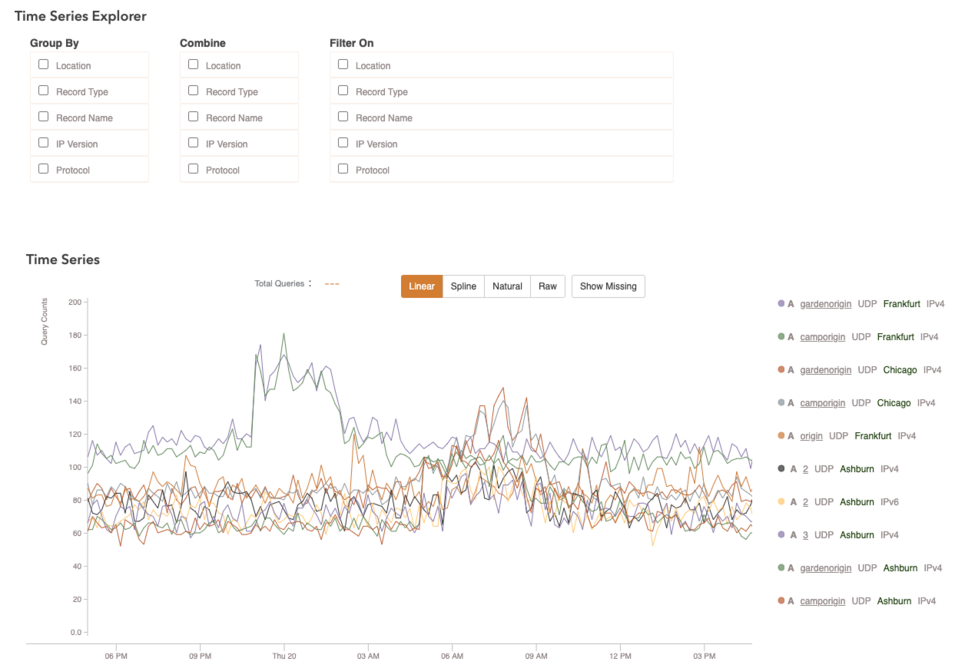
The Time Series Explorer gives you a graphical representation of queries over time based on several parameters: Location, Record Type, Record Name, IP Version, and Protocol. These parameters can be grouped, combined and filtered in a number of ways to give you a granular and customized view of your domain's queries.

Group By: displays all time series grouped by which ever parameter you choose; if you group by location then the graph will display the number of queries for all records in your domain by location over time.
Combine: instead of bringing all attention to the selected parameter like Group By, it combines all time series that share that parameter and as a result, the graph no longer reflects data based on that parameter, instead it becomes based off all other unselected parameters.
Filter By: Allows you to specify a value within a parameter to filter data, allowing you to view any individual time series with ease.

Time Series Key
The Time Series Key shows the top 500 most queried time series and allows you to hand pick which sets of data you would like to view in the graph above. Although the graph only shows 10 time series by default, you have view more or less by clicking the check boxes next to each time series. Each time series is labeled with the same parameters used in the Time Series Explorer, the one that is boxed off in the screenshot above shows that it's an A record, hostname is gardenorigin, protocol is UDP, and the queries are originating from Frankfurt over IPv4.


