Knowledge Base
DNSME Analytics
DNS Analytics offers unparalleled visibility into your domains and query usage. Find out where queries are coming from, watch them hit your nameservers in real-time, and troubleshoot network issues like never before. We are going to give you a guided tour of the DNS Analytics platform. You can follow along by logging into the DNS Analytics app at analytics.dnsmadeeasy.com.
What is DNS Analytics?
All DNS hosting providers have access to the query logs for their clients’ domains. However, only recently has the technology become available to leverage this data to provide valuable insight into domain activity. DNS Analytics allows you to view domain(s) query logs in visual forms like line and bar charts, interactive maps, and filterable tables. This information is used to:
- Troubleshoot influxes in query traffic
- Detect DDoS attacks early
- Gather insight into your DNS infrastructure
- Examine request loads on DNS servers and zones
- Compare capacity trends over time
- Identify stale or unused records
- Evaluate the effects of service or configuration changes
We hosted a live demo for a few of these use cases in a recent webinar, which you can watch at the top of this page.
Use Cases
CDN Issues
You can use DNS Analytics to pinpoint a CDN (Content Delivery Network) that is making too many requests. You can filter query logs by Source IP and contact the CDN provider that is making excess requests. This is typically the result of a misconfiguration during setup.
System Misconfigurations
Troubleshoot overages and excess queries by filtering your query logs by Source IP and Record Type. Usually happens when you turn up a new system and a configuration error will cause the system to make too many requests.
DDoS or DNS-level Attack
Filter Results by Location, Record Type, and Source IP to pinpoint the source of a DNS-level attack. You can also compare your results over different time periods by downloading query logs and comparing them in two separate browser windows. Historical data can be reuploaded to DNS Analytics (learn how) so you can detect traffic abnormalities.
How to Use DNS Analytics
Dashboard
Log into DNS Analytics by using your DNS Made Easy login credentials. View your monthly query log quota and current usage. Query logs can be downloaded on a per-domain basis and are one-minute logs of all incoming queries. Additional logs can be purchased from the DNSME control panel for $60.00/yr which allows for 5 additional query logging events each month.
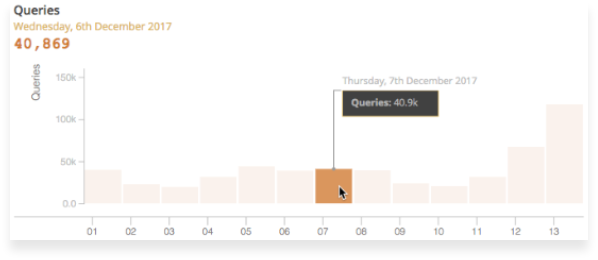
Daily Queries Bar Chart
Query counts by day for all domains in the account. All charts/tables default to a two-week time range from the current day. Available actions for all charts:
- Scroll to zoom
- Click and drag to move the map
- Hover to show additional data

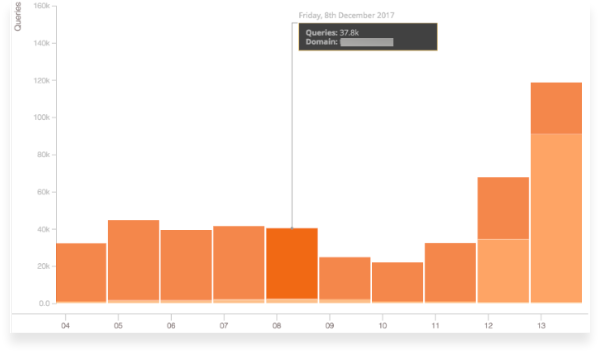
Queries by Domain Table and Chart
Use the table to quickly spot deviations in traffic. This is also where you can click on a domain name to access more in-depth analytics for that domain.
You can select domains by clicking the checkbox next to them for comparison in a stacked bar chart below the table.

Query Logging Events Table
The table displays any query logs that were requested recently.
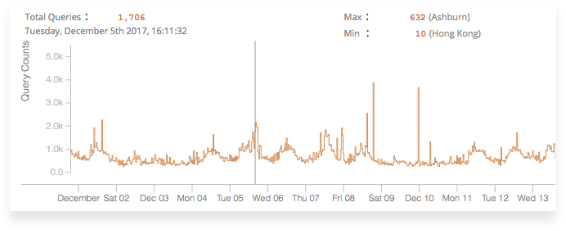
Domain Analytics
The time series displays the number of queries over the selected date range. Hover over the graph to see total queries at each 30-minute interval and min/max by location.


